
Will AI skyrocket inequality?
The canonical labor model can help

There are some absolutely crazy predictions around AI. Recently, the head of Ford said “Artificial intelligence is going to replace literally half of all white-collar workers in the U.S.” There’s literally no plausible, data-relevant definition of “white-collar workers” where that would happen. Wages will adjust. People will adapt.
But there are a ton of interesting questions, major questions, around labor markets and AI. How much will relative wages adjust? Which workers will benefit and which will lose out?
Today, I want to narrow it down even more: Will AI increase inequality?
Spoiler alert, but I don’t know. However, I think price theory gives us a framework to start thinking through it. And that framework points in some new directions.
The beauty of approaching AI this way isn’t that we get a perfect crystal ball. It’s that we get a systematic way to organize our thinking about which effects matter most and in what direction. Instead of getting lost in the details of which specific jobs AI might automate, we can focus on the big economic forces that actually drive wage patterns. That’s what price theory is for.
The Katz-Murphy Framework: Supply and Demand for Skill
Forget the sci-fi scenarios and go back to the basics. Supply and demand for different types of workers. Specifically, the framework that Larry Katz and Kevin Murphy gave us in 1992—a simple model that’s been quietly explaining wage inequality for over thirty years.
The setup is almost embarrassingly simple. Take the entire U.S. workforce and divide it into two groups: “skilled” workers and “unskilled” workers. That’s it. No detailed task categories, no industry-specific analysis, just two big buckets. Empirically, we can think of skilled as college grads and unskilled as everyone else. (We will come back to this in the AI context in a bit.)
These two types of workers aren’t perfect substitutes—you can’t just swap a college grad for a high school grad at a 1:1 ratio and get the same output. Firms can adjust their mix of workers based on relative wages and productivity. The elasticity of substitution captures how easily firms can substitute between the two groups. KM estimate this at around 1.4, meaning if skilled workers become 10% more expensive relative to unskilled workers, firms will shift toward using about 14-16% fewer skilled workers relative to unskilled workers.
On the demand side, there’s another aspect to think about; suppose technology systematically favors skilled workers. This is the famous “skill-biased technical change.” Each year, new technologies (computers, software, automation) tend to complement high-skill workers (making them more productive) while substituting for low-skill workers (automating their tasks). In the KM model, this shows up as a steady outward shift in relative demand for skilled workers. Historically, they estimate the demand shift has been remarkably constant at about 2-3% per year since 1960.
Think of it this way: every year, technology effectively creates the equivalent of 2-3% more demand for college graduates relative to high school graduates. If the supply of college graduates grows at exactly that rate, wage inequality stays constant. If supply grows faster, inequality falls. If supply grows slower, inequality rises. It’s that simple.
So that’s what workers produce for firms. That’s the demand side for abor.
The supply side is driven by educational choices. When the returns to college are high, more people invest in education, increasing the supply of skilled workers. But there’s a lag; it takes years for educational investments to show up in the workforce, and the stock of human capital changes slowly as older, less-educated workers retire and younger, more-educated workers enter.
Here’s why this framework has been so powerful: it correctly predicted the major twists in U.S. wage inequality over six decades. In the 1970s, the baby boomers flooded into the workforce with college degrees, causing the supply of skilled workers to surge faster than demand. Result? The college wage premium actually fell during the 1970s—exactly what the model predicted. Then in the 1980s, the growth in college graduates slowed just as computerization accelerated the demand for skilled workers. Result? Skyrocketing inequality—again, exactly what the model predicted.
The updated evidence through 2020 is remarkable. Using the same 2.5% annual demand growth trend estimated on 1963-1987 data, the model continues to track actual wage patterns thirty-three years out of sample.
How well? Let me answer in a roundabout way.
Acemoglu and Autor have a handbook chapter on “Skills, Tasks and Technologies.” The whole point of the chapter is to argue for a new paradigm for modeling labor economics beyond the canonical, KM-model. They are setting up KM to knock it down. And they show how the model predicts out of sample.
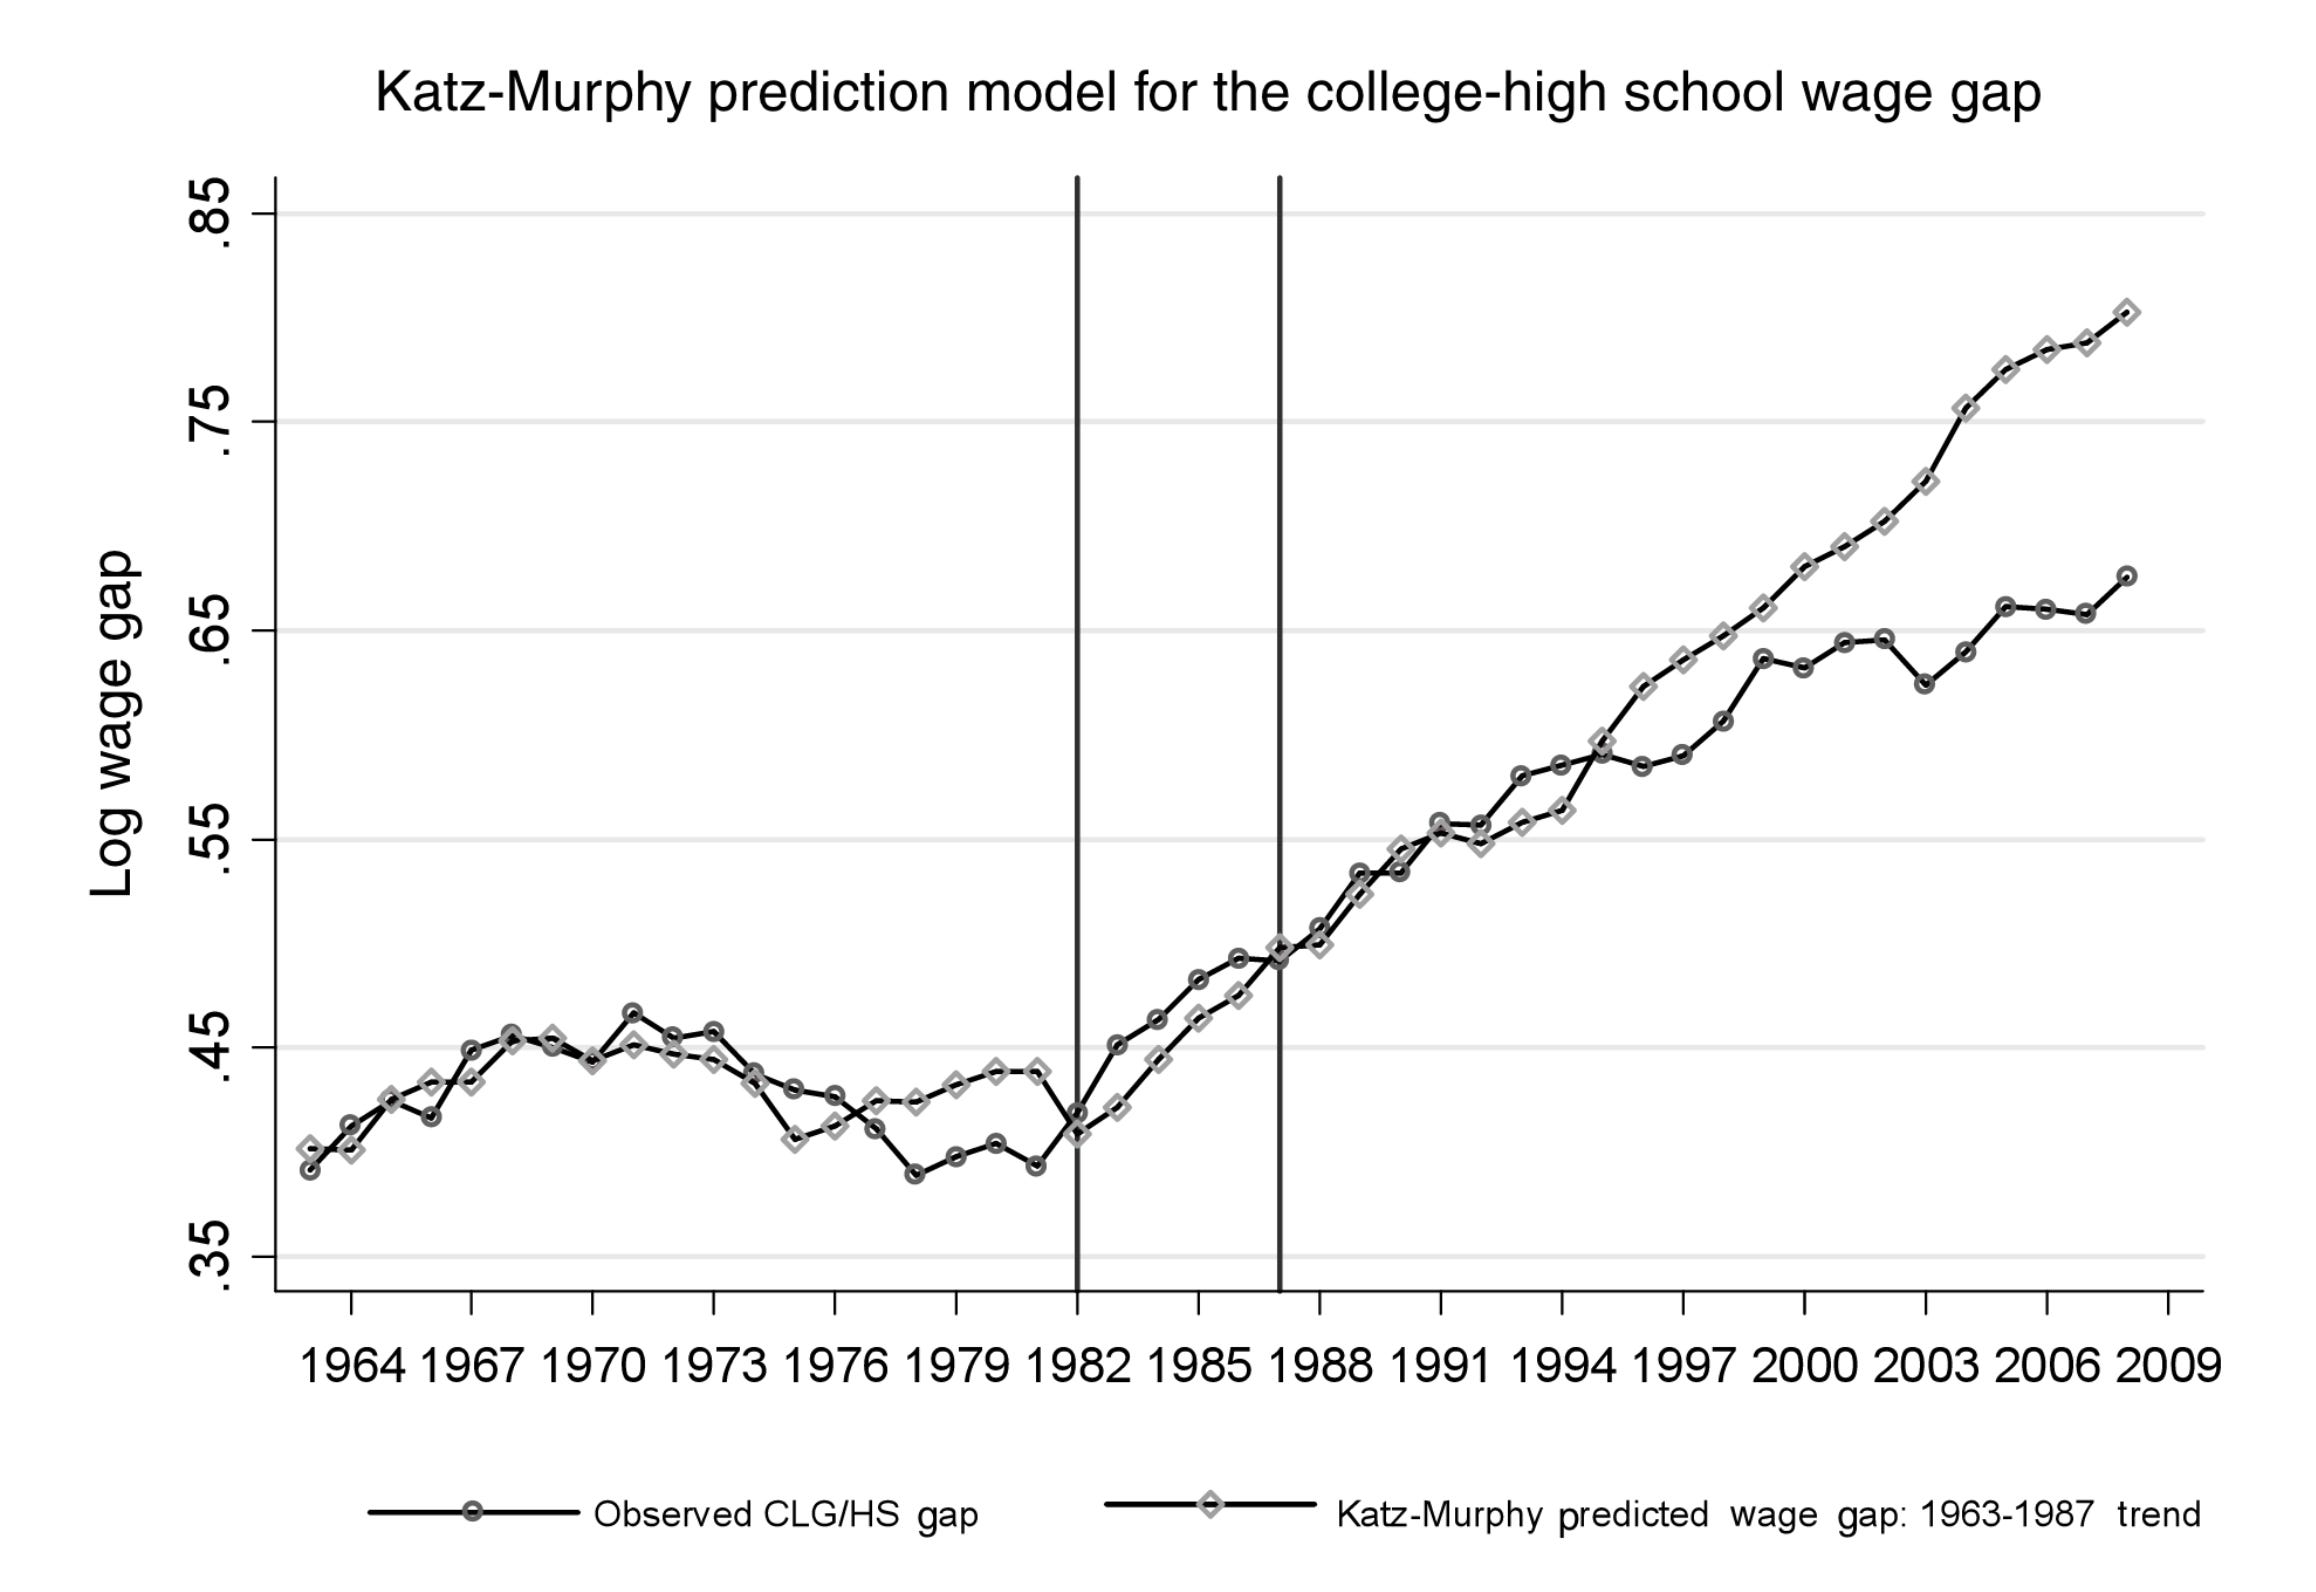
The authors say, “The model systematically deviates from the data thereafter (1987), predicting a sharper rise in the college premium than actually occurs. While the observed college premium rose by 12 points between 1992 and 2008, the model predicts a rise of 25 log points.” Fair. If you collapse the model down to the particular point estimate made in the original paper, that is correct. I’d say a model is more general than that.
But still, my takeaway is different. Look what you get with two parameters! It perfectly tracked for another 15 years. On one of the biggest questions in labor economics! That’s the power of a simple, well-constructed model.
So how does AI fit into this framework? Some people will say it changes everything. Something something, self-replicating, something. P(DOOM). Or maybe it’s just P(economy goes boom).
Instead, I think we want to think through how AI will influence the parameters and what that means going forward. I’m fine saying that the parameters will change. Technology will change differently than it did from 1963-1987. But how? We still have the same basic structure of supply and demand for skilled versus unskilled workers, but AI fiddles with both dials simultaneously.
We don’t have to rely purely on theory here. Eloundou, Manning, Mishkin, and Rock had a great early study looking at GPTs. So we are trying to extrapolate from GPTs to AI as a broader category. It’s not perfect. It’s a bit dated in this space at this point (2023). But it’s a start.
The researchers evaluated every major occupation in the U.S. economy, measuring what fraction of each job’s tasks could be significantly sped up by GPTs. First, just some general numbers: 80% of workers have at least 10% task exposure, while 19% have at least 50% task exposure when accounting for complementary technologies. That’s just exposure, not necessarily adoption, but this is from the vantage point of 2023 already.
Evidence for Higher γ: The Wage-Exposure Correlation
Higher-wage occupations show systematically higher GPT exposure. This is the exact opposite of traditional automation patterns, where technology typically displaced lower-wage workers first. The study finds that occupations requiring bachelor’s, master’s, and professional degrees show much higher exposure than those requiring only high school education. When they regress exposure on skill importance, programming and writing skills are strongly positively correlated with GPT exposure, while routine manual tasks show negative correlations.
This is precisely the signature of an acceleration in skill-biased technical change. If we translate their exposure measures into productivity impacts, we’re looking at technology that could boost the effective productivity of college-educated workers by 10-50% while leaving high school educated workers largely unaffected. In KM terms, that’s a massive positive shock to the relative demand for skilled workers. So far, so obvious—this would increase inequality.
But what if “exposure” means that GPTs can do your job? Think about tasks that used to require a college degree: writing reports, analyzing spreadsheets, basic coding, document review. AI can now help high school graduates do many of these tasks competently. In the language of task-based models, AI is yanking cognitive-routine work out of the “skilled” bucket and creating new “unskilled + AI” hybrid categories.
Translated back into KM terms, purely in the model, you might think this looks like an effective surge in the supply of skilled workers even if the actual number of college graduates doesn’t change. Suddenly you have more people who can do “skilled” work (with AI assistance), which should put downward pressure on wage premiums.
But go back to the data. This would be an increase in the relative demand for people who are labeled as unskilled labor, even if now they are “skilled” in some other sense.
This is the real horse race. Unfortunately, the Katz-Murphy model doesn’t really help us pin down this parameter ex ante. We need to see how it plays out.
Evidence for Higher σ: Task Reallocation Patterns
The GPT study also provides indirect evidence for increased substitutability between skill levels. The researchers distinguish between tasks that GPTs can handle directly versus those requiring complementary software. The key insight: many “high-skill” tasks that previously required specialized training—legal research, financial analysis, code review—now show high direct exposure. Meanwhile, other high-skill tasks requiring scientific reasoning or critical thinking show low exposure.
I’d think of this kind of task reshuffling as a force that increases substitutability. Suddenly, a senior analyst can handle document review that previously required a junior lawyer. An experienced programmer can tackle financial modeling that once needed a specialist. The boundaries between skill categories become more fluid.
A higher σ—that is, greater substitutability between college and non-college workers—does three things to wage inequality over time:
First, it flattens the wage-premium response to any demand shock. In the old KM calibration (σ ≈ 1.4), a one-shot 10% demand jump for college labor shows up as roughly a 7% wage-premium spike. Bump σ to 2 and the same demand shock translates into maybe 5%. Wages move less for a given quantity shock
Second, it makes supply shifts bite harder. When σ is low, pumping more B.A.’s into the workforce barely dents the premium; when σ is high, the same graduation boom can cut the gap in half. Translation: policy levers like immigration or community-college completion become more potent equalizers in a high-σ world.
Third, it makes the wage series more volatile. Flatten the demand schedule and you magnify the impact of every supply wobble—graduation cohort sizes, business-cycle layoffs, even AI-augmented up-skilling inside firms. Expect a rockier premium path: smaller but more frequent zig-zags instead of one long climb.
Bottom line: a bigger σ doesn’t cancel AI-driven inequality, but it does hand supply-side forces more power and compresses the amplitude of each pure demand shock.
Overall effects
My best guess? I don’t know. But I’ll say we’ll see bifurcated effects. At the top of the skill distribution, AI will act like turbo-charged technical change, where supercharged means maybe 1% more for 1 decade, not utopia-type stuff. This ends up creating huge demand for people who can work effectively with AI systems. This will drive inequality between the college-educated and everyone else. But within the college-educated group, AI might compress inequality by making routine cognitive work more accessible to workers with less specialized training.
The real question isn’t whether AI will change inequality—it will. The question is in which direction and by how much. Maybe we should split the labor market into more than two groups. Autor and Acemoglu think so. Still., the Katz-Murphy framework gives us a way to think systematically about the forces at play. But as with any good economic model, the devil is in the parameters. And those parameters are changing in real time.
No matter how you slice it, for a good long while you will need highly skilled experts in those domains most affected by GPTs to be able to determine when the GPT gives a good answer or complete nonsense. Beware of the AI doomers who are convinced all software engineers will be unemployed in 5-10 years. But, also, be wary of AI polly-annas who see the rise of AI as purely wonderful. Neither of those extremes are going to be correct.
Made me think differently. thank you