
Price controls cause chaos
Price controls are worse than you think

The 1970s were a strange time, to say the least.
Chicken farmers gassed, drowned, and suffocated roughly a million baby chicks. “It’s cheaper to drown ‘em than to put ‘em down and raise ‘em,” one Texas farmer explained. Dairy farmers slaughtered cows. Hog farmers culled breeding stock.
Why did any of this happen? Good ol’ price controls.
This isn’t another “price controls are bad” post. Well, they are. But I have a new paper with Alex Tabarrok and Mark Whitmeyer that has genuinely new stuff: a theorem explaining why price controls produce exactly this kind of “chaos,” as we call it, and a new way to measure the costs that doesn’t require assuming a demand curve.
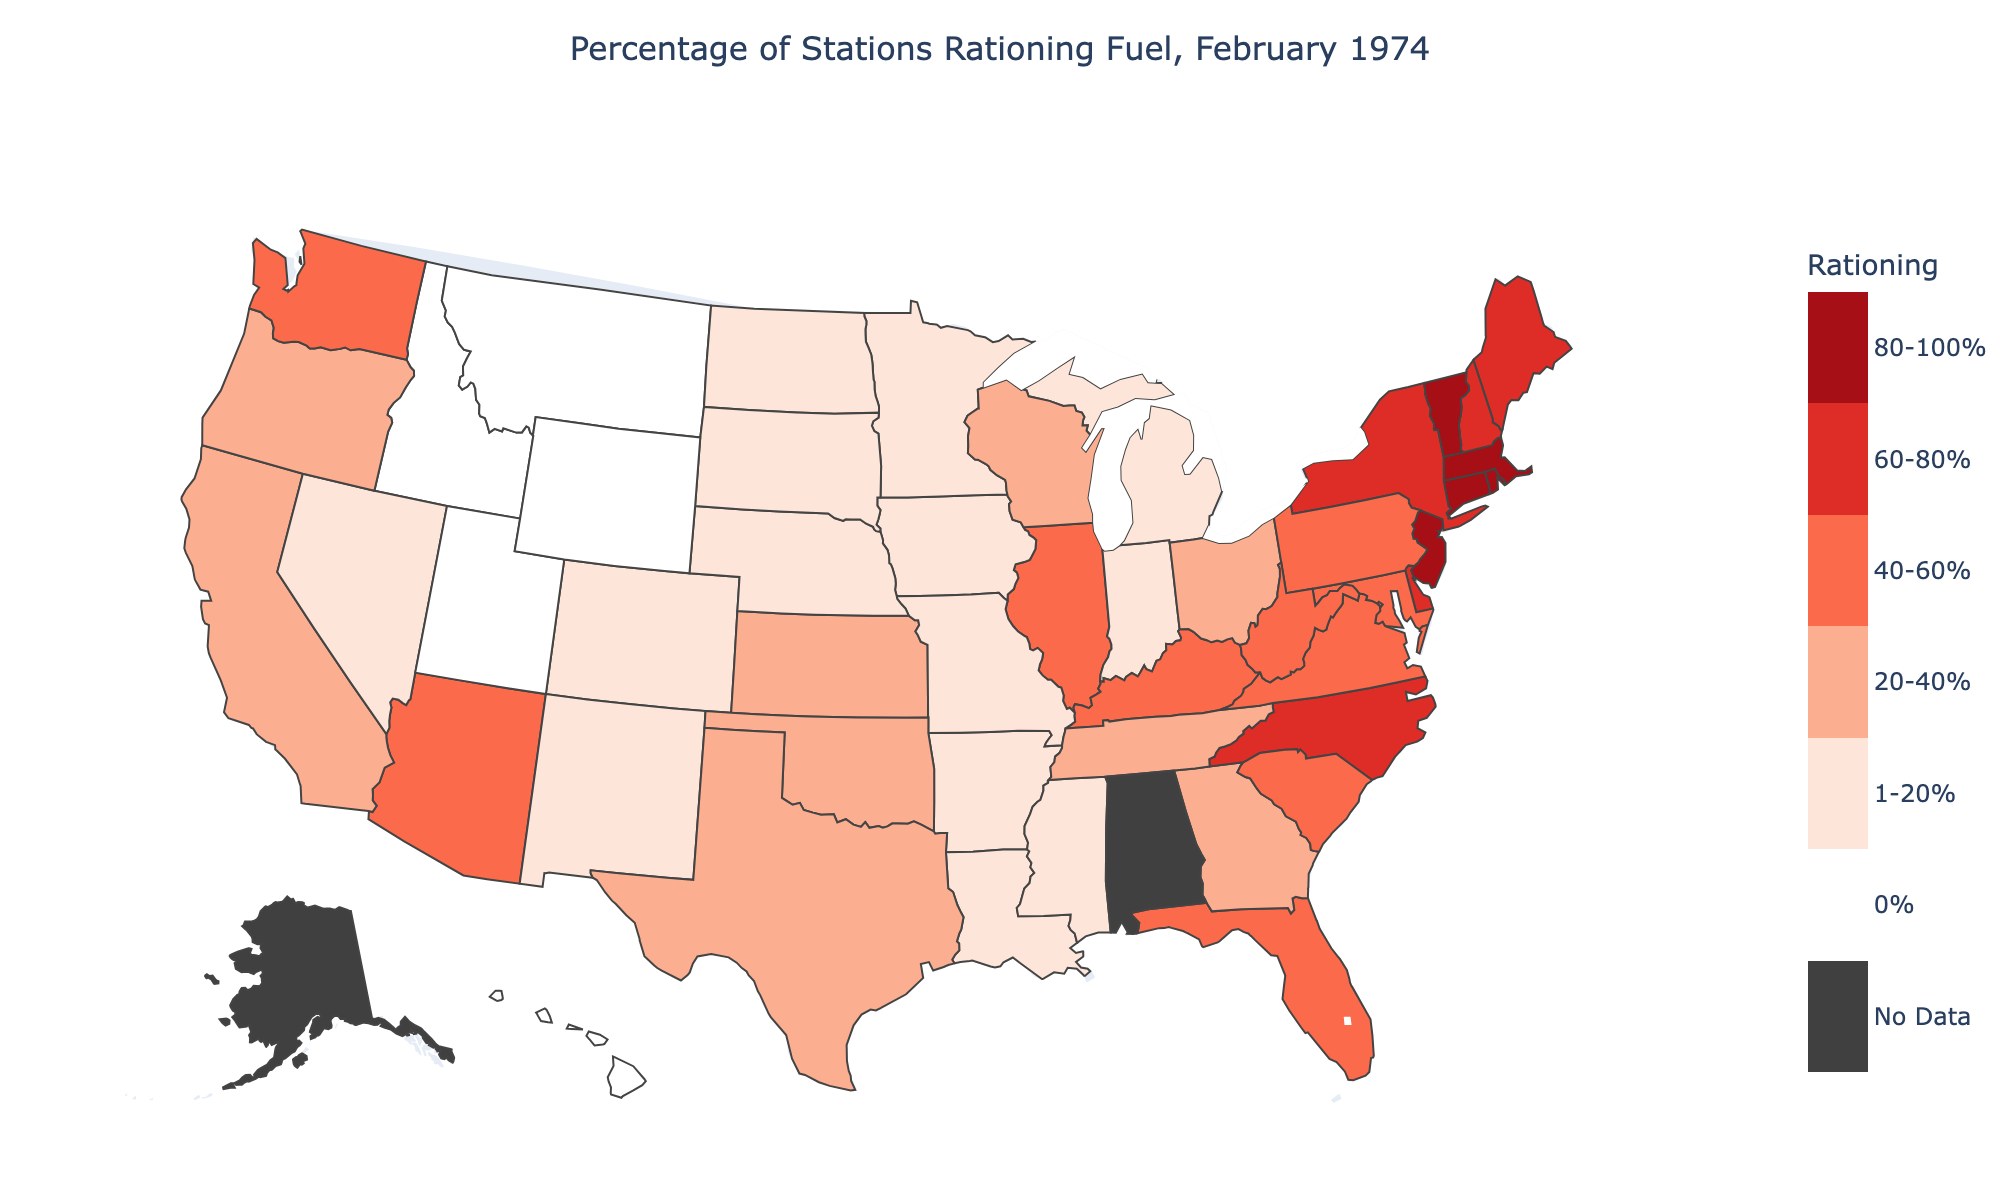
Instead of chickens, most people probaly think about the gasoline lines for 1970s price controls. I’ve written before about the 1970s gas crisis, about odd-even rationing, about violence at filling stations, about the lines disappearing overnight when controls were lifted. Lines stretched miles in Maryland and Connecticut. Over 90 percent of stations in Connecticut and Massachusetts were rationing fuel. Some had run out entirely.
But what gets less attention is the other side: in Idaho, Montana, Utah, and Wyoming, not a single surveyed station reported any problem, according to AAA survey data presented to President Ford during the crisis. Zero. Texas, the Deep South, and the Great Plains were, as Time magazine put it, “virtually awash with gasoline.”
Why would a 9 percent national gasoline shortfall produce over 90 percent of stations rationing in Connecticut and zero problems in Idaho?
The answers point to the same mechanism that explains why farmers destroy livestock rather than gradually reducing output. And the key to understanding it, as always, is price theory.
Why Arbitrage Dies
Our paper lays out why price controls produce exactly this kind of “chaos,” as we call it.
First, start with how prices normally coordinate markets. Suppose gasoline is more valuable in Connecticut than in Idaho. Under market prices, a trader profits by redirecting supply eastward. The price premium in Connecticut rises just enough to offset the cost difference. A slight cost advantage for one destination captures only the marginal tanker loads, because the price in the underserved market pushes back.
Notice what this means in practice. If it costs one cent more per gallon to deliver fuel to Connecticut than to Idaho, a supplier might redirect a few tanker loads to take advantage of the lower cost. But the price in Connecticut rises as those loads leave, and the price in Idaho falls as extra loads arrive. The price gap narrows until it just equals the cost difference. The system settles on a marginal adjustment, a few tanker loads shifted, and both markets remain well-supplied. Prices provide the pushback that limits how far any reallocation can go. This arbitrage drives markets.
Now freeze the price at the same level everywhere.
Every unit earns identical revenue regardless of destination. I have to sell at 50 cents in Idaho or in Connecticut. The government says I can’t charge more. Where do I ship? The price mechanism that usually pushes back and levels stuff out is gone. There is no premium in Connecticut to attract supply, no discount in Idaho to redirect it.
Under market prices, a one-cent cost advantage captures a marginal reallocation. In the extreme, with no transaction costs, a one-cent cost advantage under a price ceiling redirects the entire flow. Because there is no price in the destination market pushing back, a one-cent advantage is as good as a one-dollar advantage. Both redirect everything. What would have been a marginal adjustment becomes a categorical one. As Thomas Sowell stressed in Knowledge and Decisions, the economy loses its capacity for incremental adjustment and instead lurches between all-or-nothing extremes.
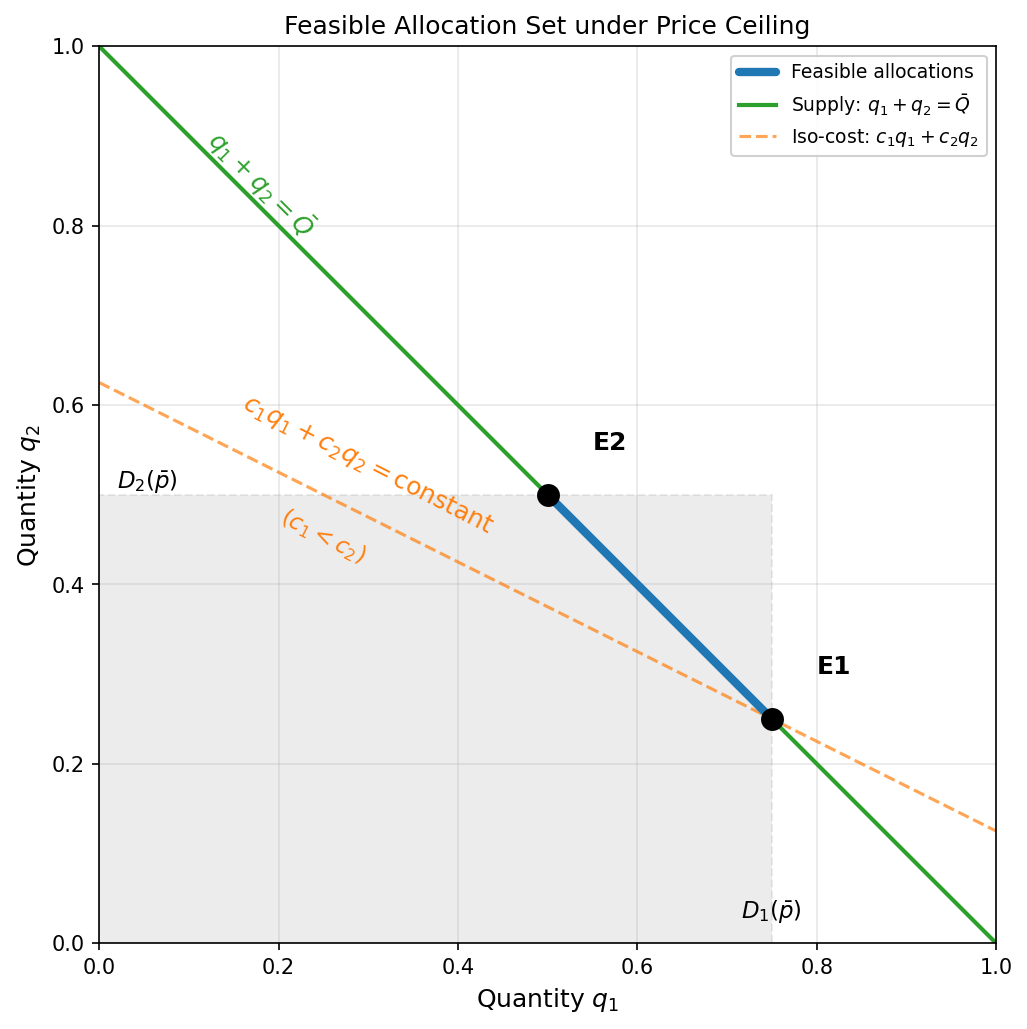
A bit of geometry makes this precise. The set of feasible allocations, all the ways you can divide a fixed total supply across markets, forms a shape with sharp corners. Under market prices, the objective (maximizing consumer surplus) is curved, so the optimum lands in the smooth interior. Under price controls, the supplier’s problem reduces to cost minimization, and cost is linear in quantity. A linear objective over a shape with corners always lands on a corner. Some markets get filled to capacity. Others get nothing. There is no “split the difference” outcome.
The figure below makes this concrete. The blue segment shows all feasible ways to split a fixed supply between two markets. It has two endpoints: E1, where market 1 is filled to capacity and market 2 gets the residual, and E2, the reverse. The dashed orange lines are the supplier’s cost curves, and because cost is linear, they are straight lines. A straight line sliding across a line segment always lands on an endpoint. When it is slightly cheaper to serve market 1, cost minimization selects E1. If that cost ranking flips by even a fraction of a cent, the allocation jumps to E2. There is no gradual slide from one endpoint to the other.
The all-or-nothing outcome emerges from the incentive structure price controls create.
The Chaos
Corner allocations are bad enough on their own. But it gets worse. Which corner the economy lands on is unpredictable.
When two markets have nearly equal delivery costs, the economy sits on a knife-edge. A refinery outage, a pipeline repair, a regulatory tweak, any small change in relative costs can flip which market gets filled and which gets starved. The allocation jumps discontinuously even though the parameter change is vanishingly small. This is what we call the Chaos Theorem.
Why “chaos”? Because under normal market conditions, small changes produce small effects. If a pipeline shuts down, prices in nearby markets rise a little, a few tanker loads get rerouted, and the system settles into a new equilibrium close to the old one. The price mechanism provides pushback that keeps adjustments gradual. Price controls eliminate that pushback. Once every gallon earns the same controlled price everywhere, the supplier’s problem reduces to pure cost minimization, and cost is linear in quantity. Linear problems do not adjust gradually. They jump between corners.
Under market prices, a pipeline repair might shift where the last few tanker loads go. Under price controls, a pipeline repair can shift where all the tanker loads go.
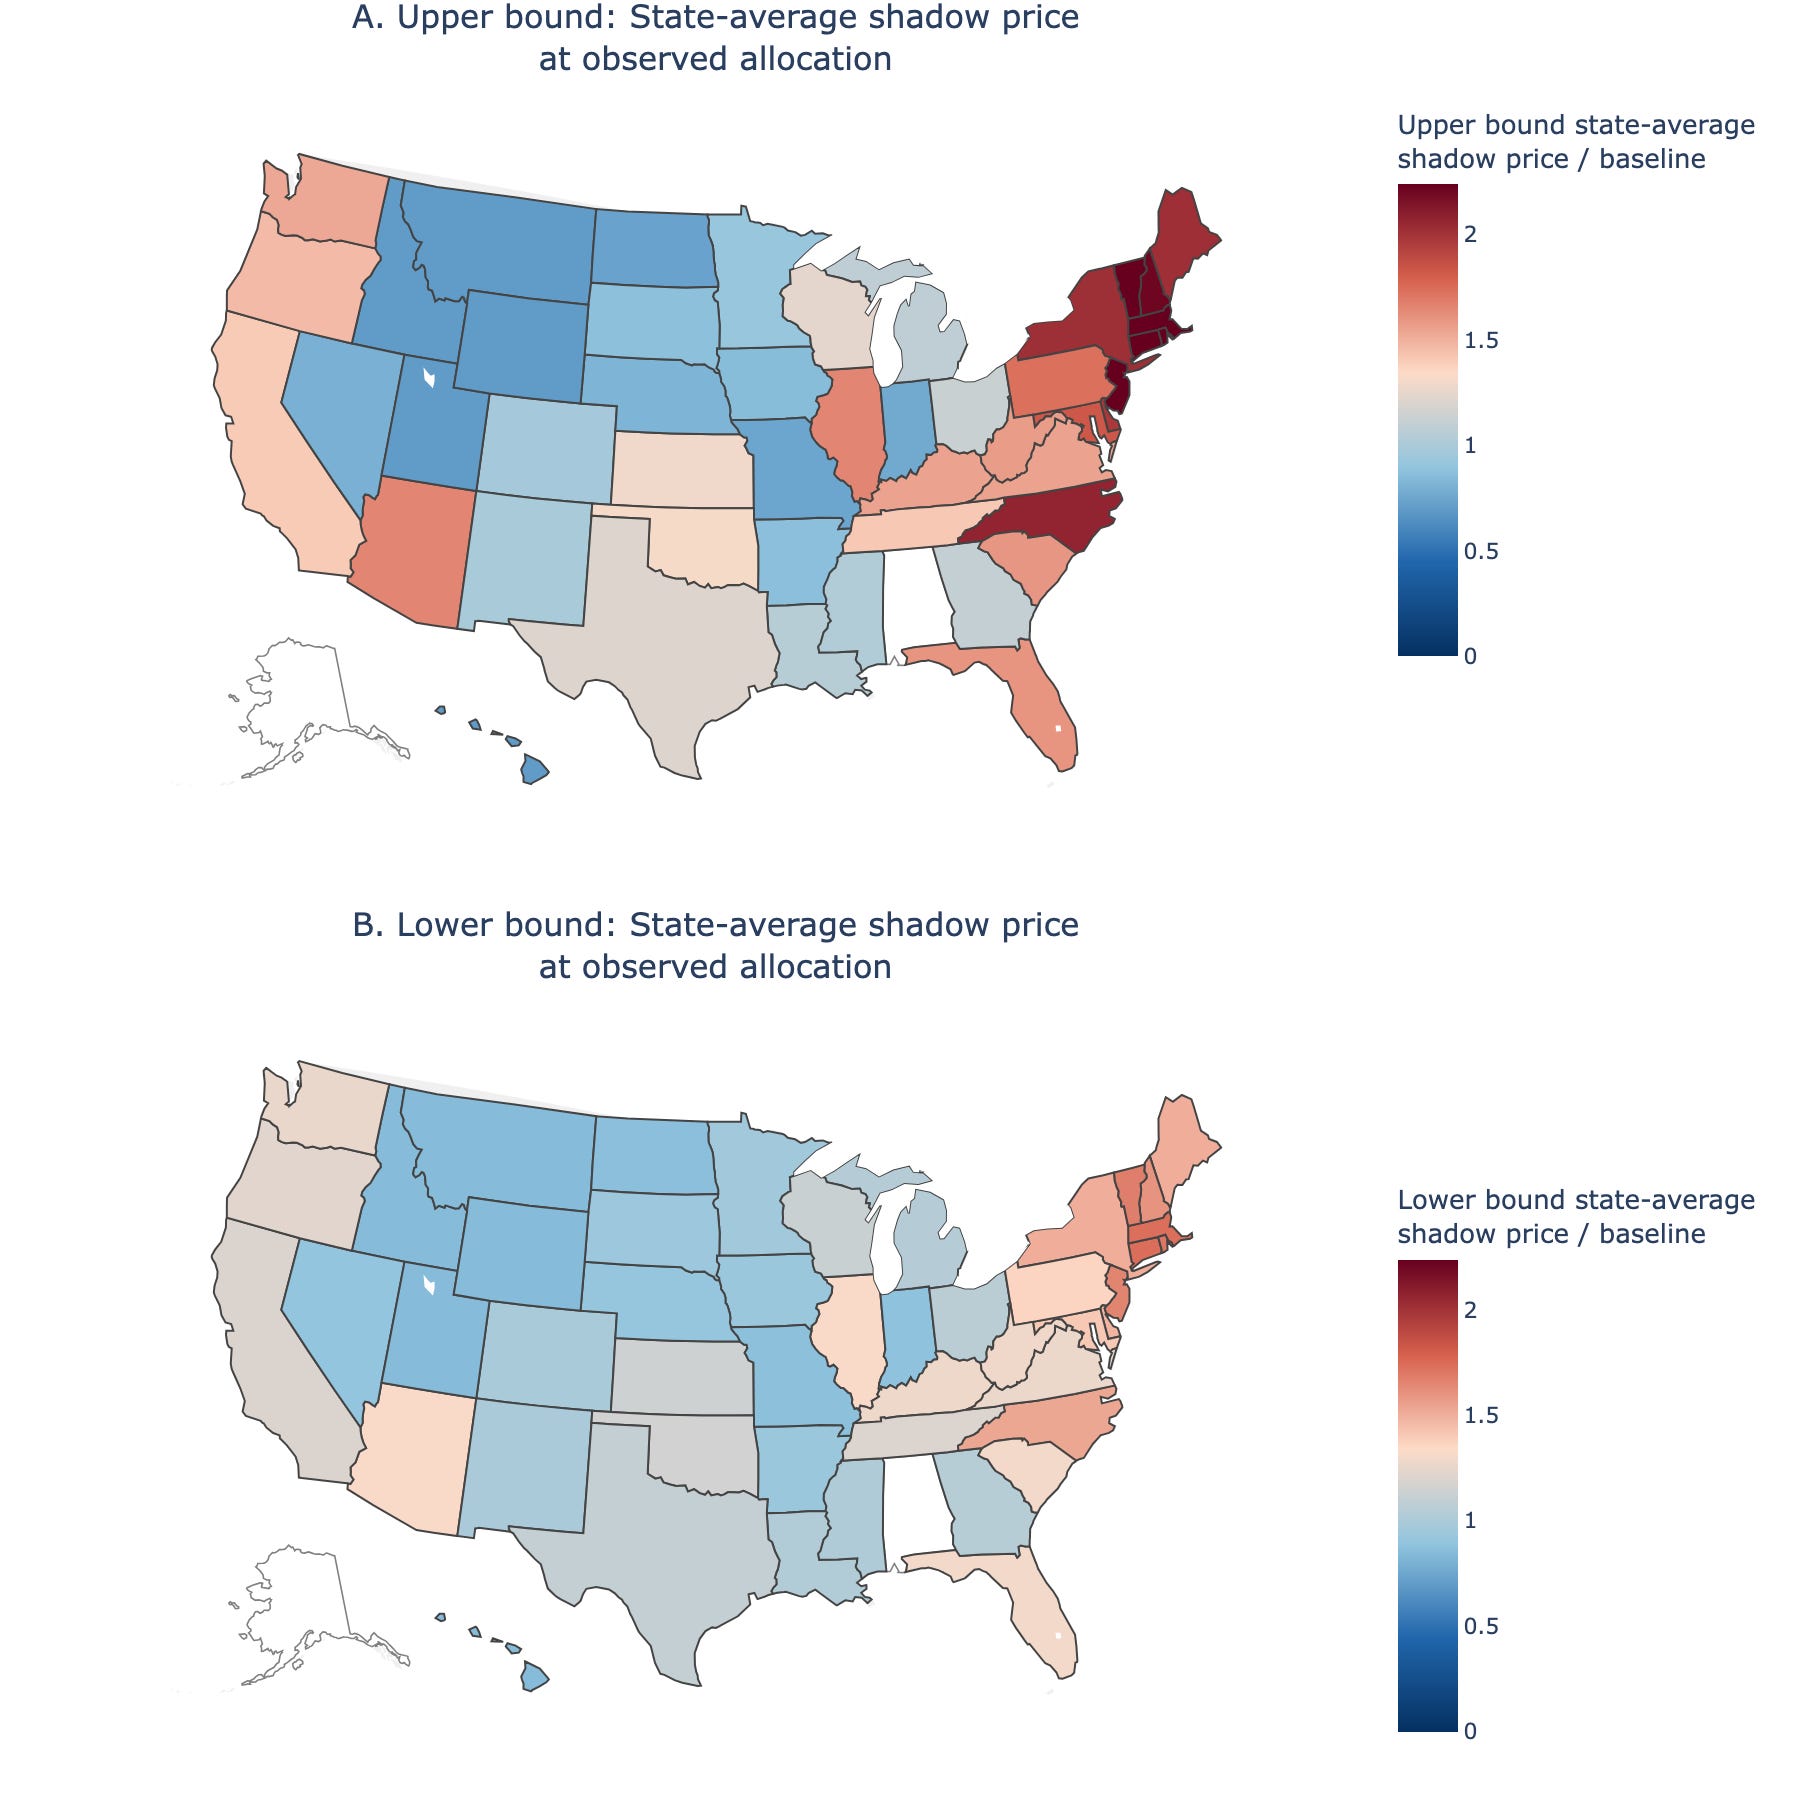
Look at that map above again. The dark red Northeast versus the white Mountain West. A natural interpretation is that Idaho got lucky and Connecticut got unlucky. But think about what efficient allocation would look like. With a 9 percent national shortfall, every market should experience roughly a 9 percent reduction, or at least some reduction. Zero rationing means those states received more than their efficient share. The states with abundant fuel are a sign of the problem, not an escape from it. Under an efficient allocation, the marginal value of gasoline, what economists call the “shadow price,” would equalize across markets. Some stations would limit purchases slightly. Nobody would have five-mile lines, and nobody would be completely unaffected.
This instability shows up whenever the price mechanism is suppressed across any segmented market. Our paper proves that whenever costs are nearly equal across two destinations, arbitrarily small changes in those costs can move welfare up or down by a fixed, discrete amount. The allocation becomes hypersensitive to “nuisance parameters,” transportation costs, regulatory discretion, historical consumption patterns, things that would be irrelevant under market clearing.
The most dramatic illustration played out in the Soviet Union over decades. Soviet citizens carried avoska bags, from avos’, meaning “perhaps” or “just in case.” You carried the bag everywhere because shortages were unpredictable: shoes today, soap tomorrow, nothing next week. People joined any queue they encountered, often without knowing what was being sold, because the queue itself signaled temporary availability. Factories “stormed,” alternating between slack periods when little happened and frantic bursts of activity as plan deadlines approached, because input deliveries were erratic and uncoordinated with production schedules. The chaos theorem applies good-by-good. Extend it across an entire economy, goods as inputs to other goods, each with its own ceiling, and corner allocations compound across stages of production. Communism is universal price controls. The avoska bag is what life looks like when allocation depends on which pipeline happens to be under repair.
As I discussed in People Act, Markets Clear, markets always clear one way or another. Under price controls, clearing happens through queuing, quality cuts, rationing schemes. The chaos theorem adds something to that picture: which market gets rationed is itself unstable.
What misallocation costs
If price controls push allocation to corners, a natural question is: how much does that cost? To answer it, we need the concept of a “shadow price,” which is a measure of what consumers would actually pay for one more gallon if they could. When goods are allocated efficiently, shadow prices equalize: the last gallon is worth roughly the same to a driver in Connecticut as to a driver in Montana. The familiar Harberger triangle assumes this equalization. It measures the cost of having less total supply, taking for granted that reduced supply still goes to the right places. That is the best case. The actual cost, driven by misallocation, was several times larger.
The map makes the misallocation visible. Idaho had zero problems, receiving more than its efficient share, even more than its uncontrolled amount, at Connecticut’s expense.
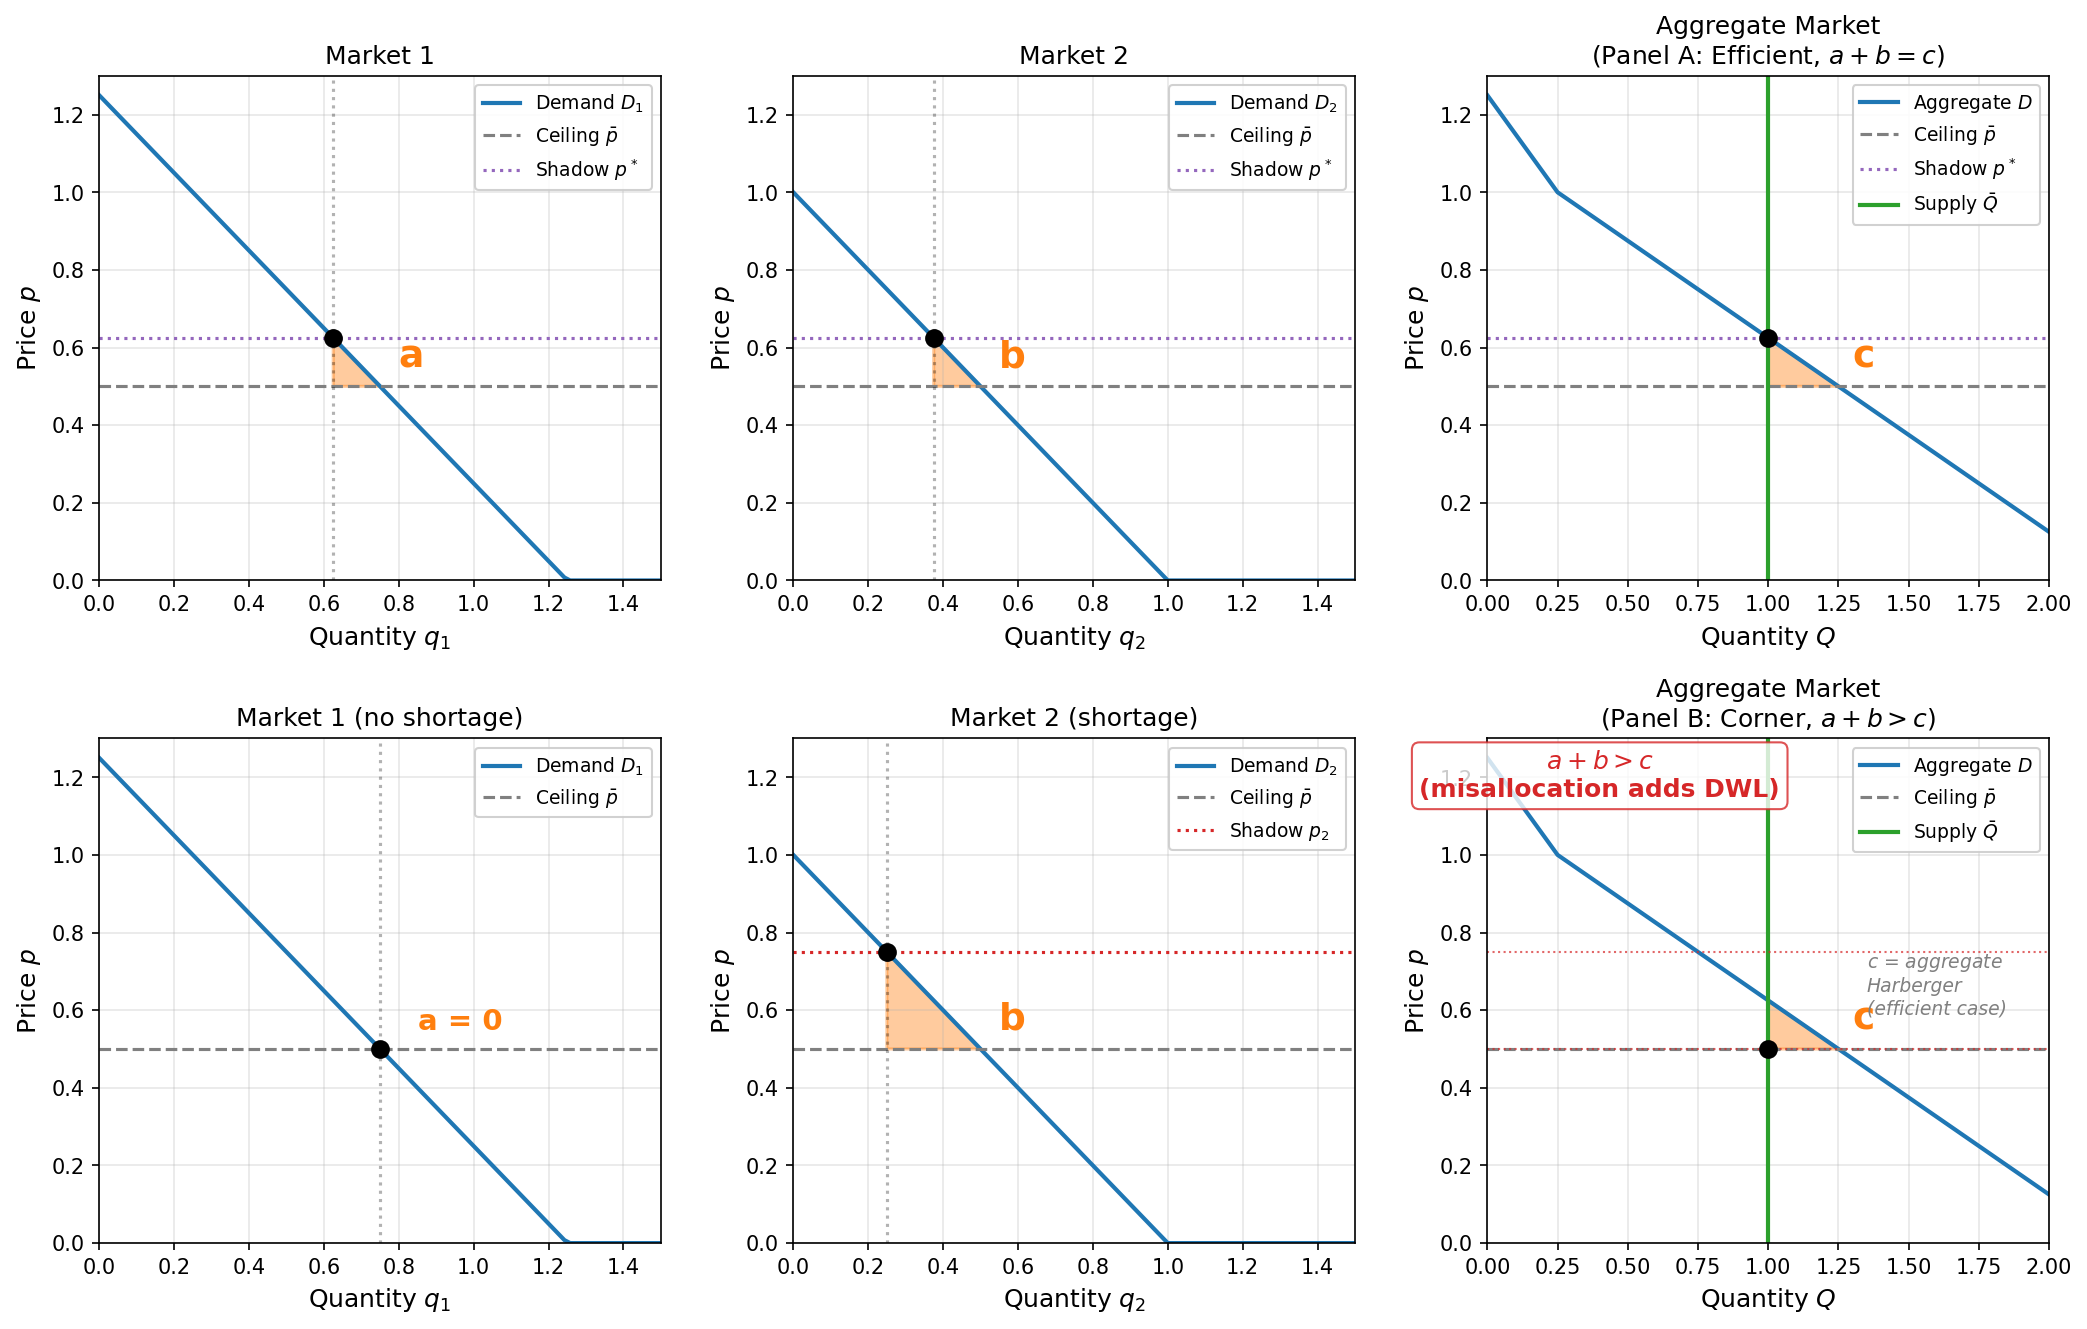
The top row is what every textbook draws: shadow prices equalize across markets, and the deadweight loss is the familiar Harberger triangle. The second row is what actually happens when cost minimization selects the allocation. One market gets everything it wants at the controlled price. The other gets whatever is left. The welfare loss in Panel B is nearly an order of magnitude larger than in Panel A. Same total supply. Same controlled price. The only difference is how that supply is distributed.
As Josh has written before, competition for scarce goods does not stop under price controls. It just takes other forms: waiting in line, quality degradation, black markets. Our paper reveals an additional mechanism. The allocation itself goes haywire, even before you account for queuing or quality cuts. The distribution of goods across markets is driven to extremes by the very same cost minimization that, under normal circumstances, would be disciplined by price variation.
States with zero rationing are a sign of misallocation, not an escape from shortage.
At the artificially low controlled price, a homeowner in Idaho might burn cheap gas heating a swimming pool while a commuter in Connecticut can’t get enough fuel to drive to work. At market prices, the commuter’s willingness to pay would easily outbid the pool heater, and supply would flow eastward. Under a binding ceiling, both pay the same price. There is no mechanism to redirect supply. The rationing in Connecticut and the abundance in Idaho are two sides of the same misallocation.
Harberger is the minimum
Every intermediate microeconomics textbook draws the Harberger triangle as the cost of a price ceiling. The quantity falls, the triangle measures the deadweight loss, the instructor moves on. This analysis is correct as far as it goes. The problem is that it assumes the reduced supply is allocated efficiently across markets, with shadow prices equalized. That is the best case.
For the 1973-74 gasoline crisis, the Harberger triangle is roughly 2 percent of baseline consumer spending on gasoline. That is the cost of having 9 percent less fuel, assuming that reduced fuel goes to all the right places.
It did not go to all the right places. Using station-level AAA survey data presented to President Ford during the crisis, we find exactly the corner-solution structure the chaos theorem predicts: 62.3 percent of stations operating normally, 27.6 percent limiting purchases, and 10.1 percent completely out of fuel. Open stations satisfied their customers at the low, controlled price. Closed and limiting stations received the residual.
But measuring how much this misallocation costs raises a problem. Normally, you need to know the demand curve to compute welfare losses, which means knowing what consumers would have paid at various prices. Price controls destroy exactly that information. When every transaction occurs at the same controlled price, observed behavior tells you almost nothing about marginal valuations. The standard approach (assume a demand curve, compute the surplus loss) smuggles in precisely the knowledge that price suppression makes unavailable. Elasticity estimates identify demand locally, near equilibrium. But rationed stations received 68 percent of baseline quantity, and many received nothing at all. We are not near equilibrium. Extrapolating a demand curve from equilibrium estimates to these depressed quantities means the answer is only as good as the assumed functional form. Assume a different elasticity or functional form, and you can get any number you want.
That is why we had to develop a new bounding approach. Rather than assume a demand curve and compute a point estimate, we ask: across all demand curves consistent with what we can actually observe (the allocation data, the ceiling price, and plausible ranges for how responsive consumers are to price changes), what are the largest and smallest possible welfare losses? The answer is a robust interval, not a point estimate that depends on getting the elasticity exactly right.
Partial identification, bounding what the data can tell you without committing to a functional form, is well-established in econometrics. What we show is how this complex problem across many states and stations collapses to a much simpler one, using the basic economic idea—really just mere accounting—that the quantities have to add up across markets.
The intuition is simple but a little counterintuitive. For the upper bound, we see some markets that are overflowed and some that are a shortage.
What would be the worst possible underlying demand curves consistent with the observed behavior? Think of a station that ended up with a lot of fuel: “open.” The worst case is that those stations should get very little in the efficient allocation. Then the gap between what they got and what they should have gotten is as large as possible. For the lower bound, we do the opposite: choose admissible shapes that compress those gaps.
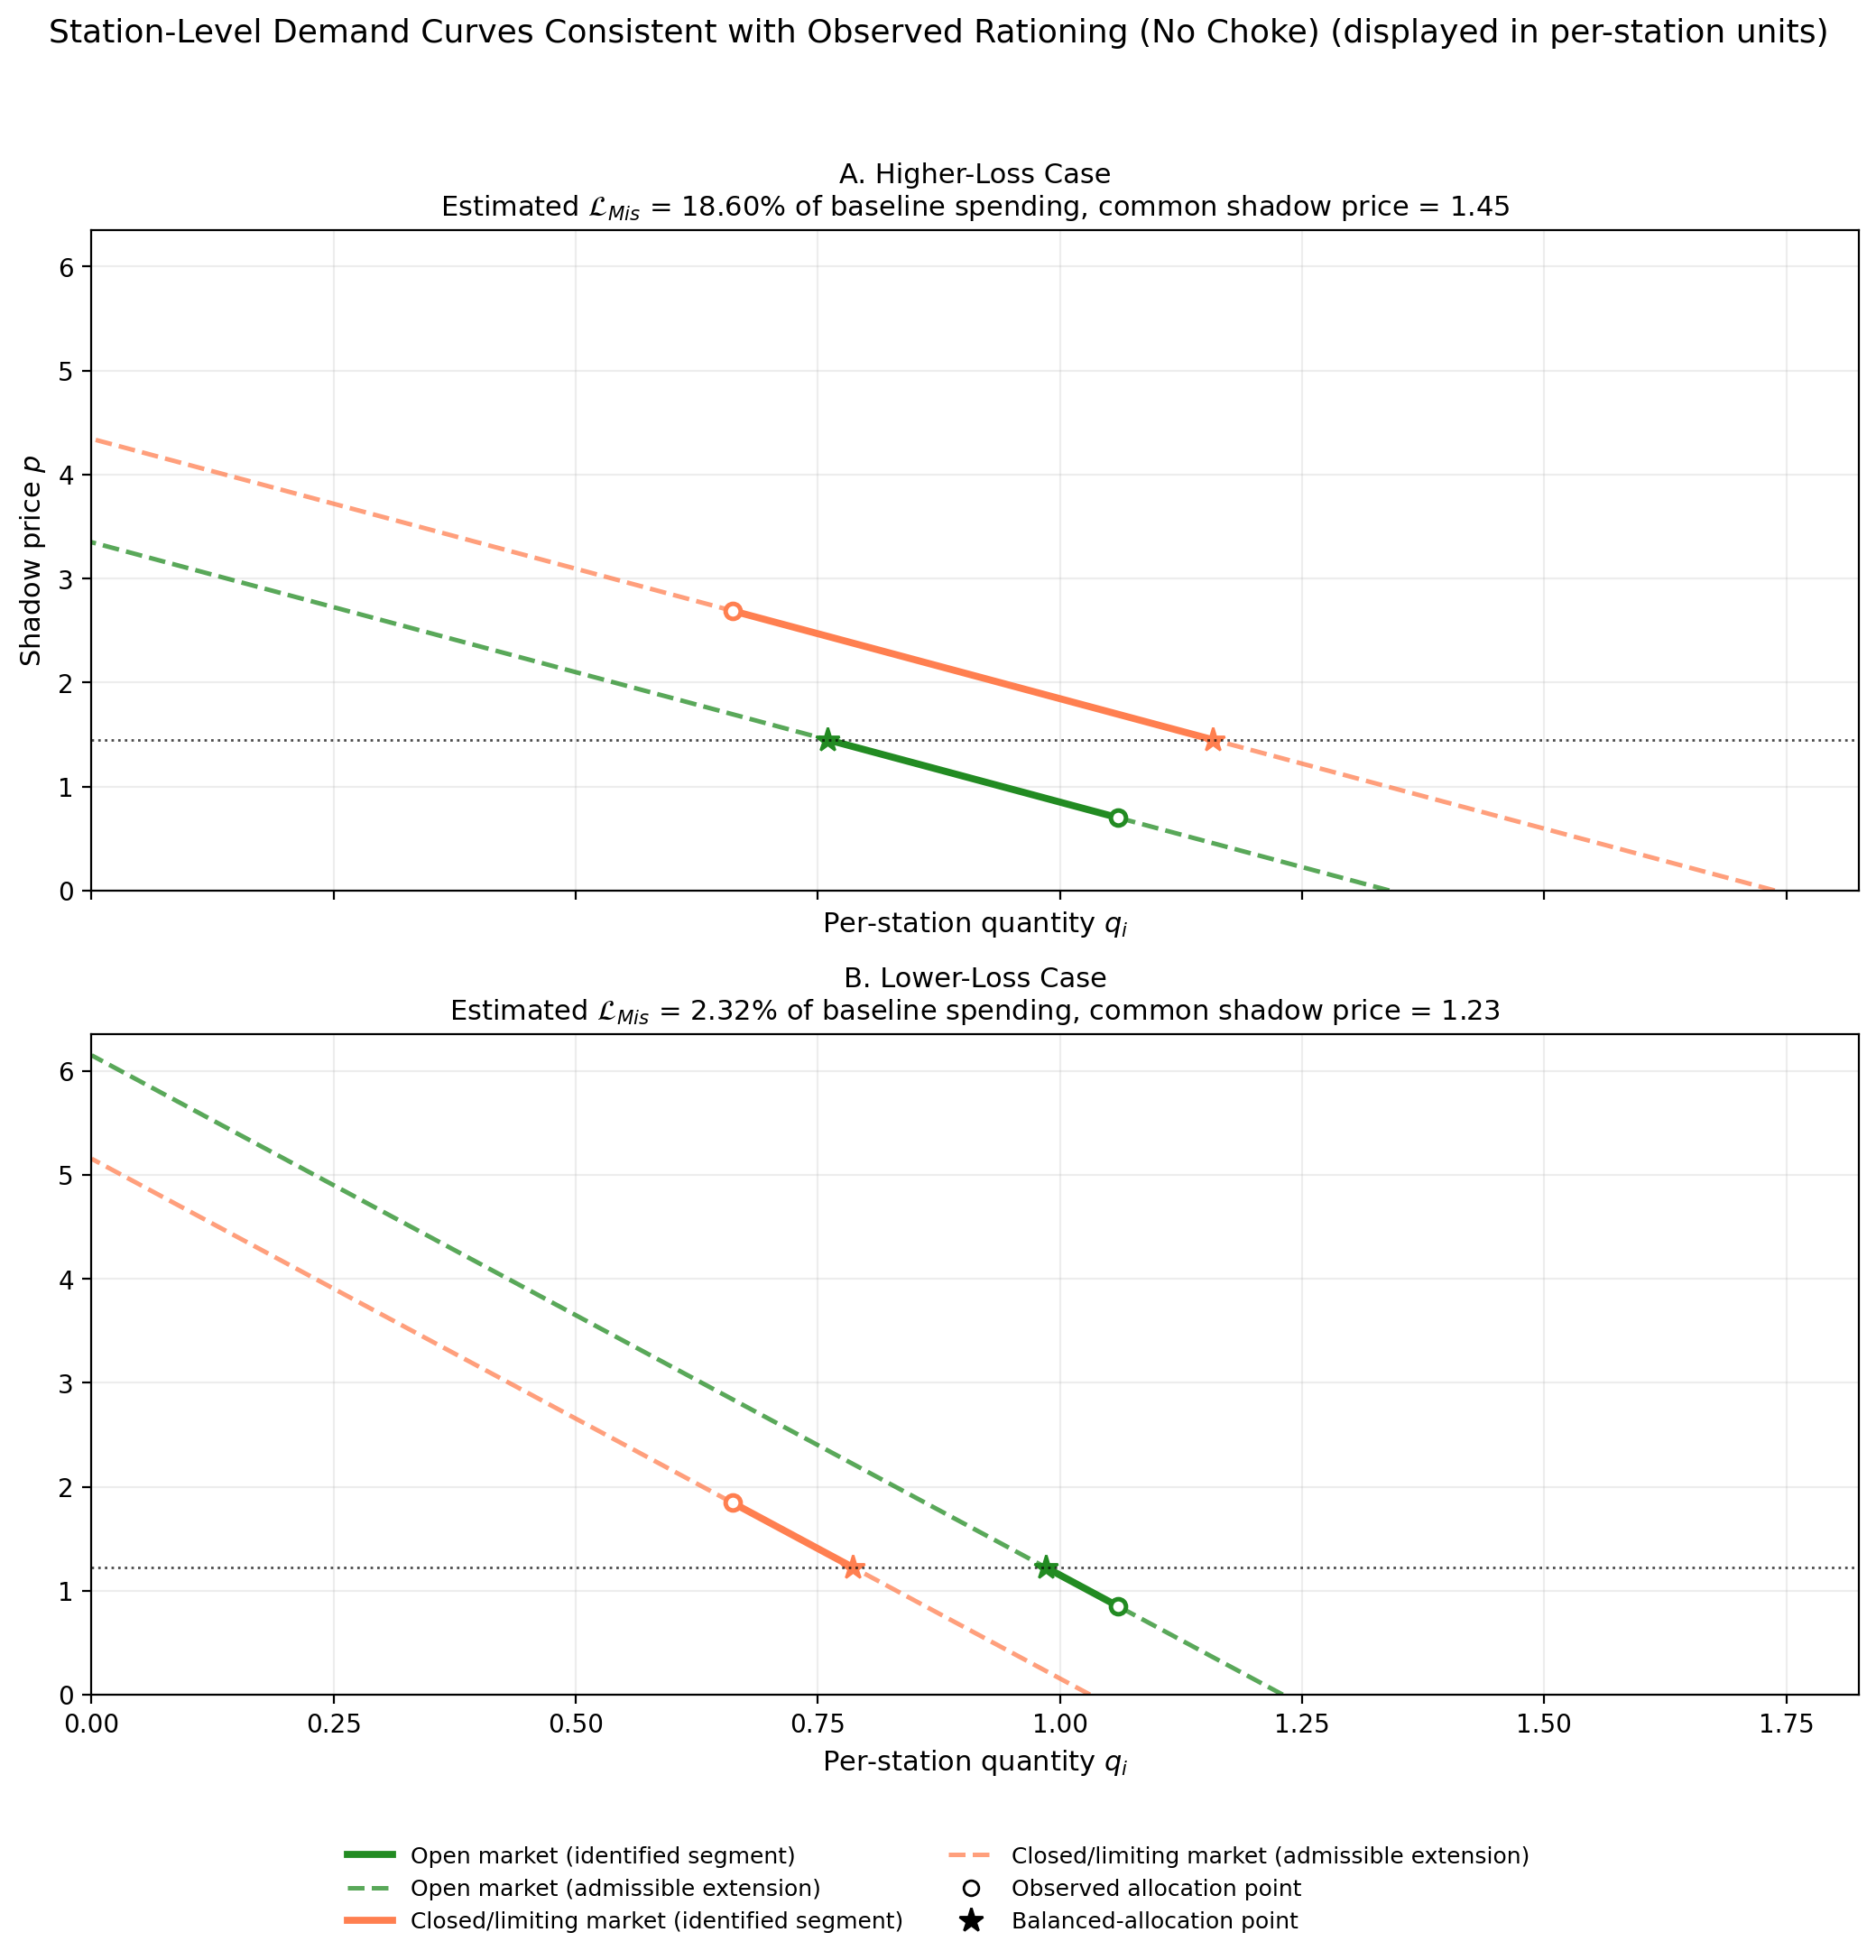
The real novelty for the multi-market case is the adding-up restriction. Total quantity is fixed, so what one market gets, another must lose. That accounting identity links all markets through a common shadow price and collapses what looks like a high-dimensional demand-shape problem into a one-dimensional search.
The nerds can check out the math.
Out of that bounding, we get shadow prices, which tell the story in a nice picture. In the upper-bound case—the configuration that maximizes welfare loss across admissible demand curves—Connecticut’s state-average shadow price was 2.5 times the pre-crisis price. Montana’s was 0.7 times baseline. Connecticut consumers valued gasoline at 3.5 times what Montana consumers were paying. Shipping a barrel from Montana to Connecticut would have more than tripled your money. That is the arbitrage opportunity that price controls created and simultaneously prevented anyone from exploiting. Even in the lower-bound case, the geographic dispersion persists. We get the same pattern, just less extreme. But still significant misallocation.
The geographic pattern is striking. The Northeast, with its high population density and commuter dependence on gasoline, shows the highest shadow prices. The Mountain West, with its sparse population and proximity to refineries, shows the lowest. Under market prices, this gap would attract supply eastward until the shadow prices converged. Under a ceiling, the gap persists because no one can profit from closing it. The queuing that Deacon and Sonstelie documented, with hour-long waits routine at hard-hit stations, corresponds to exactly these shadow price levels: when the money price cannot rise, the time price rises to fill the gap.
The misallocation loss is 1 to 9 times the Harberger triangle. That range is not a confidence interval or something like that. It is the set of welfare losses consistent with the observed allocation data and our transparent assumptions about demand slopes. The data cannot pin it down more tightly without assuming a specific demand curve, which is exactly what we are trying to avoid.
Even at the conservative lower bound, misallocation roughly equals the quantity-reduction loss. The total cost is AT LEAST DOUBLE what the textbook says. At the upper bound, the Harberger triangle accounts for barely one-tenth of total welfare cost.
Misallocation dwarfs the quantity reduction. The real cost of price controls is where the goods go. The quantity reduction is almost beside the point.
Controls beget controls
Faced with shortage-chaos, the political system was pushed toward direct quantity management. This is a natural response. If “the market” is delivering erratic, feast-or-famine outcomes, the political temptation is to step in and dictate allocations directly. And that is exactly what happened.
The Emergency Petroleum Allocation Act of 1973 ratified Nixon’s earlier executive orders with legislated price controls and an allocation system based pro-rata on 1972 consumption levels. If total supply fell to 90 percent of 1972’s volume, each buyer would receive 90 percent of their 1972 allocation. The system was then adjusted with numerous exceptions, prioritizing national defense, essential services, agriculture, and independent refiners, all under an overarching “fair and equitable” guideline. By 1979, when an even smaller national quantity reduction of about 3.5 percent led at its height to the closing of almost every gasoline station in New Jersey, Connecticut, and New York City, the Department of Energy was threatening yield regulations requiring refiners to produce a specified share of heating oil per barrel of crude. Bureaucrats instructed refiners on inventory accumulation ahead of summer gasoline demand.
Price controls tend to metastasize into quantity controls. But quantity mandates do not escape the chaos theorem. The mandated allocations are themselves fragile, because small errors in the parameters the regulator uses to set them can flip the outcome between corners. The regulator faces the same problem the price system would have solved: which markets need more, which need less, and how should those answers change when conditions shift? Without price signals, the regulator is flying blind. The regulator’s 1972 baseline was already obsolete by 1974. Population had shifted, driving patterns had changed, and the baseline bore little resemblance to efficient allocation.
As I wrote recently in the Washington Post, the new love affair with price controls is not partisan. Trump wants credit card interest rates capped at 10 percent. Sanders and Hawley have introduced legislation to do the same. New York’s mayor won his race promising to freeze rents for 2 million residents.
Whenever someone proposes a price ceiling on groceries, gasoline, rent, or anything else, the instinct is to draw the Harberger triangle and argue about how big or small it is. The triangle is the least of it. Price controls suppress the very mechanism that prevents chaos, and the resulting chaos fuels demands for ever more control, in an escalating cycle that the price system, left to operate, would have prevented from starting.
Remember the baby chicks. Remember Connecticut and Idaho. A million chicks drowned. Over 90 percent of stations rationing in one state, zero in another, schools closed for lack of heating oil. That is what happens when prices cannot do their job.
Absolutely brilliant!
PS—Do you think Mamdani will read your paper (or this post)? Your conclusion is staggering to say the least.
This is fantastic.